June update - Toward a stable release
It has been a few month since the last blog entry, as the next maintenance build is about to be released this blog entry will recap the most significant changes since the last release.
Bringing the renderer up to speed.
While not all features will make it in for the next update the new renderer has received a lot of upgrades and improvements since its initial release two months ago. The forward rendering path now supports shaders as complex as the deferred path thanks to a new shadow mapping code reducing the number of required texture units as well as reducing the shadow mapping fragment shader complexity.
A vivid example of why realtime shadows are cool.
(This is running a solid 60 fps without Fraps btw...)
Editor improvements.
Debugging scripts.
The built-in script debugger has been active for a few releases now but was lacking breakpoint support and post-mortem debugging effectively rendering it close to pointless. All these issues are resolved now and when a script breaks you will be dropped into the debugger with a callstack and the stack frame variables available for inspection.
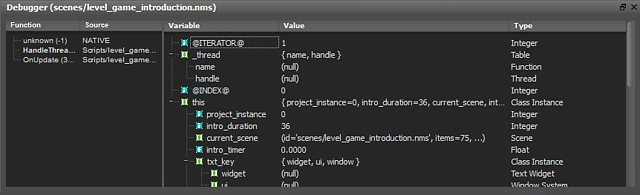
Crashed! To the debugger you shall go.
The debugger pretty much has all the features you would expect from a full blown debugger:
- Source-level breakpoint support,
- Callstack and stack frame inspection,
- Post-mortem debugging,
- Step into, step over and step out.
The most notably lacking functionality is the ability to edit variables when debugging. Unfortunately this is rendered a bit more complex than it should by the fact that the whole script debugger/profiling system is running through the network. This is of course done in order to enable remote debugging of console system or mobile phones but adds a certain amount of complexity to the editing process.
Other improvements.
The editor also received a lot of work on the usability front. A new Window menu has been added to reopen vital panels that you might have unexpectedly closed. The resource thumbnails are now cached as they could take a lot of time to compute on each launch.
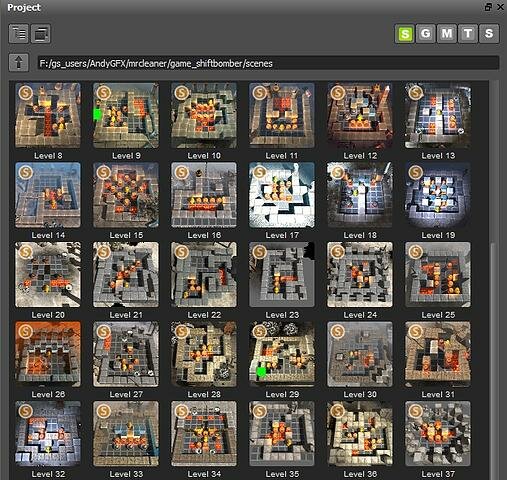
AndyGFX and François made it clear it was becoming painful
to watch those being calculated again and again...
A performance and memory profiler are now available both when editing and previewing a scene or a project. When working on a scene these are enabled through the viewport Display drop-down menu. During a preview the Debug menu provides the same entries.
Also recently added is an application launcher which is now automatically created and packaged along your application when publishing it.
Licensing terms.
To conclude this update I would like to say that work is ongoing to finally bring clear licensing terms and get them published on this website. The standard version price has been fixed to 149€ and will let you use all features with no restrictions and publish free of charge on Windows and other desktops as support is added in.
A solution to provide access to the engine and framework source code is also being studied. Feel free to discuss your ideas on the subject in the comment thread below or on the forums. As usual GameStart really is about its users so we are waiting for you input on this matter.
Thanks and see you on release day!
- Mr.Admin's blog
- Log in or register to post comments
Comments
dlzerocool
Sat, 08/20/2011 - 18:40
Permalink
Would be good to have some news on the Linux editor.
Is there a testable beta ?
I'm looking for a multi-platform engine and the Linux development tools are mandatory.
Mr.Admin
Sat, 08/20/2011 - 19:08
Permalink
Hi,
Unfortunately the Linux editor would be too much frustration in its current state and my focus is on reaching a stable Windows version. After this is done I should be able to concentrate on the OSX/Linux builds.
I am sorry that I cannot give you a better answer than this at the moment.
dlzerocool
Sun, 08/21/2011 - 14:42
Permalink
Thanks for the quick answer, sadly I'll have to look for another engine then.
Best wishes for your engine.